Skip to content Skip to sidebar Skip to footer

Usage & Attitudes Study

Understanding consumer behavior, preferences, and trends in Vietnam’s beverage market

Overview

Market Context

  • Vietnam’s refreshment beverage market valued at approximately $5.2 billion in 2024.
  • 5.8% annual growth, outpacing overall beverage sector (4.2%)
  • Growing urbanization driving out-of-home consumption
  • Rising health consciousness influencing product formulations
  • International brands compete with increasingly sophisticated local players
  • E-commerce and delivery channels creating new consumption occasions

Vietnam Refreshment Beverage Market Size

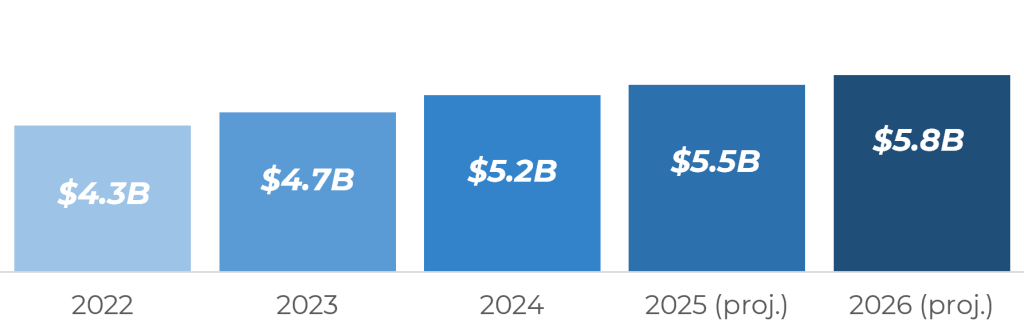
Source: Primary research/ EuroMonitor/ Nielsen, Government statistics, distributor and retailer interviews.

Research Objectives

  • Analyze consumption patterns across refreshment beverage categories.
  • Identify category-specific purchase drivers and barriers.
  • Evaluate competitive landscape and brand performance.
  • Understand consumption occasions and need states.
  • Map emerging trends and innovations in the sector.

Fieldwork Details

Sample Size: 524.

Demographics: Men & women aged 16-55.

Geography: Urban & suburban areas across 5 key cities: Hanoi, HCMC, Da Nang, Can Tho, Hai Phong.

Methodology: Quantitative online survey, supplemented with in-home visits and retail audits.

Fieldwork Period: November 2024 – January 2025

Category Performance & Consumption

Weekly Consumption by Category

“Which of the following refreshment beverages do you consume at least once a week?” (n=524)

Consumption Volume & Frequency

CategoryAvg. Purchase Volume
(L/month/user)
Consumption Frequency
(times/week)
Carbonated soft drinks4.83.2
RTD tea5.63.5
Energy drinks2.82.4
Sports/ Isotonic drinks3.22.1
RTD coffee2.51.8

Seasonal Consumption

Summer (May – Aug)

  • Peak consumption across all categories (+32% vs. yearly average).

Rainy Season (South Vietnam)

  • Lower on-the-go consumption (-18%)
  • Increased delivery orders (+24%)

Tet Holiday Period

  • Increased consumption of premium options
  • 58% higher multipack purchases

Winter (North Vietnam)

  • Lower cold beverage consumption (-25%)
  • RTD coffee shows minimal seasonality

Category Insights:

  • Carbonated soft drinks maintain category leadership with 75% weekly consumption.
  • RTD tea (68% weekly consumption) has established itself as a mainstream refreshment option, with strong appeal among younger consumers (78% of Gen Z consume weekly).
  • Energy drinks show higher penetration among males (58%) compared to females (26%), with strongest consumption in urban areas and among 21-34 age group.
  • RTD coffee shows the strongest growth (+18% YoY) though from a smaller base, driven by innovation in flavors and packaging.
  • Sports/ Isotonic drinks are expanding beyond traditional workout occasions, with 52% of consumption now occurring during regular workday occasions.

Consumption Occasions &  Need States

Consumption Occasions

“On which occasions do you typically consume refreshment beverages?” (n=524)

Primary Need States

32%

Refreshment

24%

Energy Boost

18%

Enjoyment

8%

Health Benefits

6%

Social Status

Category Performance by Occasion

OccasionLeading Category
Social gatheringsCarbonated soft drinks (68%)
MealsRTD tea (52%)
On-the-goRTD tea (48%)
Work/study breaksEnergy drinks (42%)
Physical activitySports drinks (76%)
Relaxing at homeCarbonated soft drinks (45%)

Format & Packaging Preferences

Container PreferencesSize Preferences
PET bottles most popular overall (58%)

Cans preferred for carbonated drinks (62%)

Glass bottles for premium occasions (74%)
On-the-go: 250-350ml formats (68%)

Social/ home: 1L+ multipacks (52%)

Energy drinks: smaller formats preferred (85% <250ml)

Growing demands for mini-cans (180-200ml)

Brand Performance by Category

Carbonated Soft Drinks

RTD Tea

Energy Drinks

Brand Loyalty by Category

65%

Carb. Soft Drinks

58%

RTD Tea

52%

Energy Drinks

42%

Sports Drinks

38%

Juice Drinks

“Do you usually purchase the same brand when buying this type of beverage?”  (% answering “Always” or “Usually”)

Brand Association Map

Brand Performance Insights

  • Multinational brands maintain strong leadership in carbonated soft drinks, but local brands are gaining ground in RTD tea and energy drinks segments.
  • C2 dominates the RTD tea category with 62% usage, successfully positioning itself as both refreshment and health-oriented through “natural tea antioxidants” messaging.
  • In energy drinks, local brand Sting (58% usage) outperforms global leader Red Bull (45%) by effectively targeting price-sensitive segments and emphasizing local taste preferences.
  • Tea+ shows strongest growth in the RTD tea category (+18% YoY usage), driven by successful low-sugar variants and premium positioning.
  • Brand loyalty varies significantly by category: highest in carbonates (65% loyal to primary brand), lowest in sports drinks (42% loyal).
  • Private label penetration remains low (8% overall) but shows growth in modern trade channels (+15% YoY).

Purchase Drivers & Barriers

Key Purchase Drivers

“Which factors most influence your decision when purchasing refreshment beverages?” (n=524)

Category-Specific Drivers

CategoryPrimary DriverSecondary Driver
Carbonated soft drinksTaste (95%)Brand (72%)
RTD teaRefreshment (82%)Natural ingredients (68%)
Energy drinksEnergy boost (88%)Taste (76%)
Sports/ Isotonic drinksHydration (85%)Electrolytes (72%)
RTD coffeeEnergy boost (75%)Taste (68%)

Purchase Barriers

“What factors prevent you from purchasing refreshment beverages more often?” (n=524)

Price Sensitivity by Category

62%

Energy Drinks

58%

RTD Coffee

52%

Sport Drinks

42%

RTD Coffee

38%

Juice Drinks

“How important is price in your purchase decision?”
(% saying “Very important”)

Consumer Segments

Value Seekers

32%

Demographics: Mixed age groups, lower-middle income, both urban and rural areas.

Attitudes: Highly price-sensitive, minimal brand loyalty, pragmatic approach to refreshment.

Behavior: Frequent promotions, prefer affordable local brands, higher consumption of RTD tea and carbonates.

Key brands: Local brands, Number 1, C2, Mirinda.

Preferred categories: RTD tea, carbonates.

Purchase channels: Traditional markets, convenience stores.

Key purchase drivers: Price, promotions.

Functional Benefit Seekers

24%

Demographics: 18-34 years, mixed income, skewing male.

Attitudes: Seek specific functional benefits, energy boost, performance enhancement.

Behavior: High consumption of energy and sports drinks, interested in fortified beverages, usage tied to specific activities.

Key brands: Sting, Red Bull, Revive, Number 1 Active.

Preferred categories: Energy drinks, Sports drinks.

Purchase channels: Convenience stores, on-the-go.

Key purchase drivers: Efficacy, performance.

Segmentation Insights

  • Value Seekers is the largest segment (32%) and are particularly sensitive to economic fluctuations, with consumption patterns closely tied to disposable income.
  • Health-conscious segment shows fastest growth (+5 percentage points YoY), with increasing interest in sugar-reduced and “better for you” options across categories.
  • Functional Benefit Seekers drive growth in sports and energy drinks categories, increasingly seeking specific functional benefits beyond basic refreshment.
  • Social Experiencers, while smallest, have the highest per-capita spending and are critical for premium product adoption and social media buzz generation.
  • Opportunity exists for cross-segment innovation, particularly products that bridge Health-conscious and Functional Benefit Seeker preferences (e.g. natural functional beverages).

Emerging Trends

Emerging Product Trends

“”Which of the following trends interest you most?” (n=524)


Digital & Purchase Trends

68%

Research beverages on social media

52%

Participate in brand promotions

48%

Use food delivery for beverages

42%

Follow beverage brands online

18%

Have tried a product from TikTok

Category-Specific Innovation Areas

CategoryInnovation FocusGrowth Potential
Carbonated soft drinksZero sugar, natural sweeteners, functional additionsMedium (+4-6% YoY)
RTD teaEnhanced functional benefits, premium craft varietiesHigh (+8-10% YoY)
Energy drinksNatural energy sources, reduced sugar, added benefitsHigh (+10-12% YoY)
Sports/ Isotonic drinksNatural electrolytes, expanded occasion usageMedium-High (+7-9% YoY)
RTD coffeePremium craft varieties, functional benefitsVery High (+15-18% YoY)

Flavor Innovation Preferences

Most Popular Flavors

  • Traditional: Citrus, Berry, Cola.
  • Growing: Tropical fruits, Herbal blends.
  • Emerging: Vietnamese inspired (lychee, calamansi)

Flavor Innovation

  • 68% interested in local fruit flavors.
  • 52% open to herbal/ botanical infusions.
  • 45% interested in flavor combination..

Conclusion & Recommendations


The Vietnamese refreshment beverage market presents significant growth opportunities through health-oriented innovation, targeted segmentation, and evolving distribution strategies.


1. Prioritize health-oriented reformulations

Develop reduced/ zero sugar variants and natural ingredient formulations across all categories to address the dominant barrier of sugar content (82%)

2. Develop segment-specific product strategies

Create targeted offerings for the growing Health-conscious (28%, +5pts YoY) and Functional Benefit Seeker (24%, +2pts YoY) segments, focusing on natural functional beverages that bridge both segments.

3. Invest in RTD coffee and sports drinks innovation

Invest in RTD coffee (+18% YoY) and sports drinks (+12% YoY) through expanded occasion positioning and premium/ functional options.

4. Optimize digital and EC strategies

Strengthen social media presence and e-commerce capabilities to engage the 68% of consumers who research beverages on social media and the growing 45% who purchase through e-commerce channels.

5. Leverage local flavor preferences

Develop localized Vietnamese flavor profiles to create distinctive offerings that resonate with the 68% of consumers interested in local fruit flavors and capitalize on the growing trend toward cultural authenticity.

Additional Analysis

Brand Loyalty by Demographics

Key Insights

  • Clear pattern of increasing brand loyalty with age.
  • Younger consumers (16-24) most experimental with 43% loyalty.
  • Middle-aged consumers (35-44) show balanced loyalty (57%).
  • Older consumers (45-55) most brand loyal, particularly to established international brands (64%).
  • Carbonated soft drinks generate highest loyalty across all age groups.

Brand Loyalty by Demographics

Geographic Insights:

  • Urban centers with greater retail diversity show lower brand loyalty.
  • HCMC most dynamic market with lowest loyalty (48%).
  • Regional preferences evident in category loyalty: Northern cities show stronger RTD tea loyalty.
  • Smaller cities like Hai Phong exhibit higher overall loyalty (60%).
  • International brands maintain consistent loyalty across regions.

Emerging Trends by Age Demographics

Trend16-24
16-24
25-34
35-4445-55Overall
Reduced sugar76%85%91%88%85%
Functional benefits82%85%78%67%78%
Natural ingredients65%74%78%71%72%
Vitamin-fortified68%72%65%51%64%
Plant-based energy75%65%54%38%58%
Premium/ craft72%64%42%30%52%
Sustainable packaging58%54%42%26%45%

Key Implications

  • Reduced sugar options have broad appeal across all demographics.
  • Premium/craft shows the biggest demographic gap (42% between youngest and oldest).
  • Health-focused messaging can connect functional benefits across age groups.
  • Younger consumers are most receptive to sustainable packaging.

Key Generational Insights

Gen Z (16-24)

Leaders in innovation adoption with highest interest in plant-based energy (75%) and premium offerings (72%).

Millennials (25-34)

Strongest health orientation with peak interest in functional benefits (85%) and reduced sugar (85%) – most receptive to multi-benefit innovations.

Gen X (35-44)

Most concerned about sugar reduction (91%) and natural ingredients (78%) – prioritize practical health benefits over lifestyle positioning

Older Consumers (45-55)

Strong sugar reduction interest (88%) but significantly lower engagement with emerging trends – represent opportunity for health-oriented reformulations of traditional products.

Category Flavor Landscape

Key Flavor Insights:

  • Vietnamese-inspired flavors show strongest growth across categories, with traditional ingredients reformulated for modern beverage formats
  • Health-oriented flavor profiles gaining traction, particularly herbal infusions in RTD tea and natural plant-based variants in energy drinks
  • Traditional flavors maintain leadership but show limited growth as the market matures
  • Category crossover flavors (e.g., green tea energy drinks) represent significant innovation opportunity:
    • Health Conscious: Herbs, coconut, green tea.
    • Social Experiencers: Fruit combinations, novel flavors.
    • Value Seekers: Traditional citrus, orange.
    • Functional Benefit Seekers: Classic formulations

Strategic Opportunity:

Develop Vietnamese-inspired flavors that combine local cultural relevance with health positioning.